-
Multiple regression and R and R squaredInferential Statistics from Amsterdam 2021. 5. 31. 19:55
In this page, I'm going to talk about multiple regression and how to calculate R and R squared in multiple regression.
1. Multiple regression : you might guess what it means when you see the name. It doesn't have a big difference compared to linear regression. It just has more variables than simple linear regresison. It also means that as you consider more variables, you could get higher probability to predict correctly. Let's see how the equation looks like.

You can add variables if you want to. But Sadly, you can't describe the equation beyond 3 dimensions. Because nobody knows how the dimension forms. Since we live in 3 dimensional place, we can draw 3 dimensional graph. It looks like this.

The purple plane is an example of how a plane looks like in 3 dimension if you have two predictors and one response variable. That plane represent the predicted value by our model.
** Note that the size of each regression coefficient depends on the scale of the predictor. So we can't say that the predictor age, which is larger, is more influential in predicting popularity than the other predictor.
** Another thing to note is that the value of the regression coefficient for a predictor in a multiple regression equation is different from the value in a simiple regression equation even though the observations are the same.
2. R and R-squared : In simple linear regression, r(correlation coefficient) means how strongly the variables are linearly related to each other. R squared means how closely our sample approximates the ideal straight line. In multiple regression, It uses the same concept. But the way how to calculate R is different.
2-1) R(multiple correlation coefficient) : we do something similar by determining how strongly the response variable is related to the set of predictors. It's the correlation between the response variable and predictor scores. This is the formula.
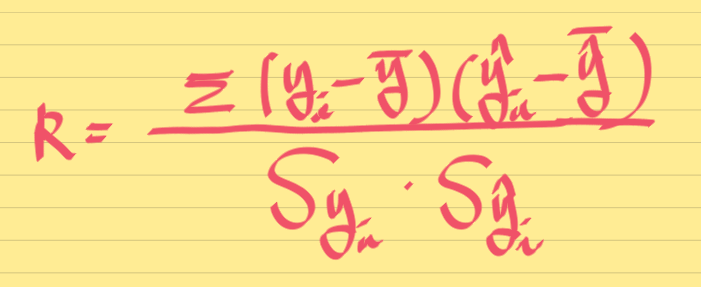
When the set of predictors predicts the response variable perfectly, the multiple correlation will be perfect and equal to 1. But, if the set of predictors is entirely unrelated to the response variable, the predicted score will be the mean of the reponse variable, resulting in a multiple correlation of 0.
2-2) R squared : It's calculated in the exact same way we do in simple linear regression. As i said, R squared means the proportion of variation.
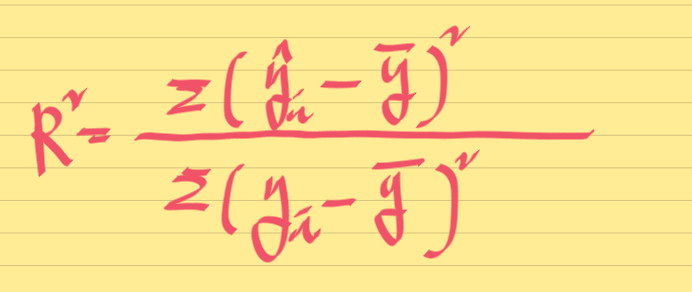
The best case is when the predicted score is equal to the observed score, then the value of R squared is equal to 1. But if the predicted score isn't related to the observed score at all, then the value of R squared is equal to 0.
** Note that as we add predictors to our model, the R squared value either stays the same or gets larger. In other words, It can never get smaller.
** You can calculate multiple R by taking the square root of R squared, because multiple R cannot be negative.
'Inferential Statistics from Amsterdam' 카테고리의 다른 글
One way ANOVA-post hoc t-tests and Factorial ANOVA (0) 2021.06.24 One way ANOVA and Assumptions and F-test (0) 2021.06.23 Categorical response variable (0) 2021.06.22 Checking assumptions and Categorical predictors (0) 2021.06.21 Overall test and Individual tests (0) 2021.06.03